
Waste Management Key Performance Indicators (KPIs) for 2026
If you work in the environmental services industry—whether at a local waste-hauling operation or a global resource management firm—you know how critical it is to measure performance accurately.
Handling diverse streams of waste, navigating complex regulations, and meeting sustainability targets all hinge on well-defined Key Performance Indicators (KPIs). From landfill diversion rates to contamination levels, these metrics provide a clear lens into both operational efficiency and environmental impact.
This article dives into KPIs that leading companies like Waste Management, Republic Services, and Veolia use to boost performance, engagement, and compliance.
Defining Waste Management KPIs
Waste management KPIs help organizations slice through the complexities of how waste is collected, treated, and ultimately disposed of. For HR teams, these indicators aren’t just abstract data points; they’re windows into employees’ day-to-day habits and motivations. A good KPI might measure how much organic waste is composted versus trashed, but the deeper story is whether your employees actually feel responsible for reducing their environmental footprint.
A major provider like Waste Management Inc. (WM) publishes an annual sustainability report that tracks safety metrics alongside GHG emissions and diversion rates. Their data-driven approach has been successful partly because they involve frontline teams in setting and reviewing goals, instead of just sending out top-down targets. Having employees participate in shaping these targets fosters a sense of ownership you just don’t get from email memos alone.
Categories of Waste Management KPIs
Environmental Indicators
These might include diversion rates, greenhouse gas (GHG) emissions, or the volume of materials recovered for reuse. From an HR standpoint, they’re a great way to publicize the organization’s progress and give employees tangible benchmarks to aim for.
Operational Indicators
Think of metrics like fleet efficiency, equipment downtime, or contamination rates in recycling streams. These may not sound like the typical HR realm, but encouraging workers to handle waste properly often demands solid training and clear communication.
Financial & Economic Indicators
Cost per ton, revenues from recyclables, and ROI for waste-to-energy projects fall under this category. When employees realize their ideas can lower disposal costs—or even generate extra income—you’ll likely see more engagement in the day-to-day.
Social Indicators
Whether you measure employee engagement, community feedback, or safety outcomes, social KPIs reflect the human side of waste management. These metrics can highlight how staff training and local partnerships pay off in goodwill and public trust.
How Waste Management KPIs Connect to Employee Performance Goals
- Waste Generation & Composition - Track how much trash the organization produces, then break it down by type—like plastics, metals, organics, or hazardous waste. Companies can display these stats on breakroom bulletin boards, so everyone sees how they’re doing each month.
- Diversion Rate - This measures the percentage of waste channeled away from landfills (through recycling, composting, or waste-to-energy). It’s ideal for encouraging friendly rivalry between departments—who doesn’t love celebrating a record-breaking month?
- Contamination Rate - If too many non-recyclables slip into recycling bins, sorting costs skyrocket and morale can drop. Frequent refreshers, especially during new-hire orientation, can nip contamination problems before they explode.
- GHG Emissions - Emissions from transporting and processing waste sometimes get overlooked. But if you start linking CO2 reductions to departmental scores or performance incentives, you’ll be surprised how quickly employees adapt.
- Financial Metrics - Keep an eye on disposal expenses and any revenue gained from selling recyclables. Teams become very creative once they realize how much money they can collectively save (or earn).
Key Performance Indicators for Waste Management Roles
Effective waste management relies on tracking role-specific Key Performance Indicators (KPIs) to measure performance and drive improvements. Common metrics span operational efficiency, service quality, and compliance across municipal agencies and private companies. Below we present example KPIS for common roles in waste management organizations.
Waste Management Drivers
On-Time Collection Rate – Percentage of waste pickups completed on schedule. Target: 95% or higher for reliable service.
Missed Pickup Rate – Number of missed collections per 1,000 pickups. Minimizing this improves customer satisfaction and avoids service penalties.
Tonnage Collected per Route – Average waste collected per route/shift. Higher tonnage indicates greater productivity and efficient routing.
Fuel Efficiency – Fuel consumption per mile or ton collected. Better efficiency reduces costs and emissions.
Safety Incident Rate – Frequency of accidents/injuries per 100,000 miles. Low rates ensure worker safety and regulatory compliance.
Route Supervisors or Team Leaders
Route Schedule Adherence – Proportion of routes completed within planned timeframes. Ensures on-time service and controlled overtime.
Truck Capacity Utilization – Load weight vs. maximum truck capacity. Target: 85-100% utilization to reduce unnecessary trips.
Workday Utilization – Percentage of workday spent on actual collection vs. non-productive time. Target: 90%+ without excessive overtime.
Team Safety Incidents – Safety incidents among supervised crews. Low counts reflect strong training and oversight.
Customer Service Issues – Complaints on managed routes. Low complaint counts indicate effective supervision and service quality.
Recycling Coordinators
Waste Diversion Rate – Percentage of waste diverted from landfills through recycling/composting. Target: 50% or higher for sustainability goals.
Recycling Participation Rate – Proportion of eligible households/businesses actively recycling. Higher rates indicate successful outreach.
Recycling Contamination Rate – Percentage of non-recyclable materials in recycling streams. Target: under 10% to maintain processing efficiency.
Material Recovery Efficiency – Share of collected recyclables actually processed into new materials. Higher efficiency optimizes operations.
Recyclables Revenue per Ton – Revenue from selling recovered materials or net processing cost. Ties performance to economic outcomes.
Waste Facility Operators or Plant Managers
Throughput – Daily/weekly tonnage processed. Consistent targets indicate efficient operations and capacity management.
Equipment Downtime – Hours of equipment unavailability due to maintenance/breakdowns. Minimizing downtime maintains productivity.
Cost per Ton Processed – Operating cost per ton including labor, energy, maintenance. Lower costs indicate efficient operations.
Safety Incident Rate – Workplace injuries per 100 workers annually. Target: zero incidents for safe working environments.
Regulatory Compliance – Adherence to environmental/operational regulations measured by violations or compliance scores. 100% compliance expected.
Customer Service Representatives
Customer Satisfaction Score (CSAT) – Direct satisfaction measurement via surveys. High scores indicate service meets expectations.
Net Promoter Score (NPS) – Customer loyalty metric measuring likelihood to recommend services. Higher scores show customer advocacy.
First Contact Resolution (FCR) – Percentage of inquiries resolved on first contact. High FCR indicates efficient support without escalation.
Average Response Time – Speed of response to inquiries (call wait times, email response, ticket closure). Fast response improves experience.
Complaint Rate – Customer complaints relative to total customers/services. Low rates suggest proactive issue resolution.
Administrative or Compliance Officers
Regulatory Compliance Score – Overall adherence to required regulations and permits. Target: 100% compliance with zero violations.
Safety Training Completion – Percentage of employees completing mandatory training. Target: 100% completion for safety culture.
Incident Rate (Recordables) – Organization's Total Recordable Incident Rate (TRIR). Low rates indicate effective risk management.
Timely Reporting – Percentage of regulatory reports and permit renewals submitted on time. Ensures legal standing and transparency.
Audit Findings – Number of non-compliance findings from inspections. Goal: minimal findings with prompt resolution.
Methods & Tools for Measurement
Getting dependable numbers on waste streams requires both hardware and a bit of organizational finesse. SUEZ, for example, implements “smart bins” with sensors that signal when they’re close to capacity, ensuring drivers aren’t wasting time on half-empty containers. This data also provides real-time insight into which neighborhoods or facilities generate the most waste, helping managers (and HR) spotlight where additional training might be needed.
On top of sensor technologies, dedicated software platforms can aggregate all your waste data in one place. HR directors say that having a user-friendly dashboard—often accessible by employees—is the single most effective way to boost engagement. Pair that with regular audits or spot checks to maintain accuracy, and you’ll catch issues like unexpected contamination patterns before they spiral out of control.
Setting Targets & Improvement Strategies
Before you can set realistic goals, you need a solid baseline. That usually means a thorough audit of your current waste processes—whether that’s daily weigh-ins for dumpsters or a departmental review of disposal bills. Once you know where you stand, you can craft SMART goals. Organizations often shoot for a 20% bump in diversion rates within six months by focusing on better bin labeling and targeted staff training.
At Republic Services, for instance, site managers might get a bonus if they surpass certain recycling metrics, incentivizing them to run workshops or collaborate with nearby vendors for special material pickups. At times, even small wins—like trimming office paper waste by 5%—can build momentum and spark more ambitious projects.
And don’t overlook the power of cross-functional check-ins; a quick monthly meeting between HR, Ops, and Finance can unearth cost-saving measures (like bulk purchasing or new reuse schemes) that no one department would’ve noticed alone.
Performance Management & Technology
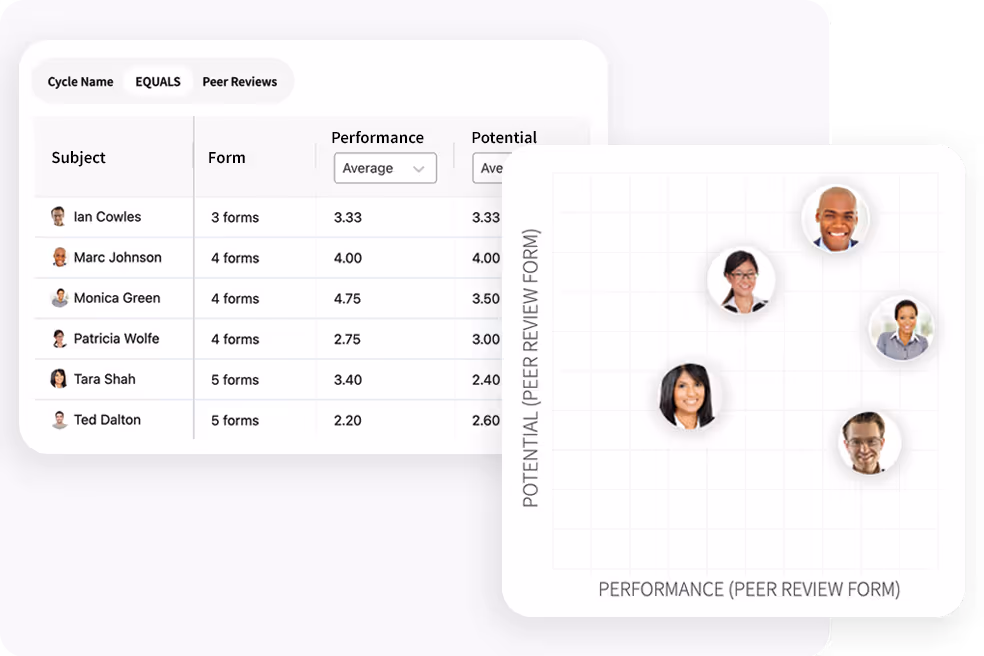
A growing trend in waste management is integrating performance management software—often used by HR for employee evaluations—with the actual metrics on waste handling. By feeding real-time data on contamination rates, collection efficiencies, or recycling revenues into these systems, you can give team leaders precise, up-to-date feedback on how they’re doing. For instance, a driver at Veolia might log into the same platform that tracks performance reviews to see a dashboard of daily routes, average fuel usage, and contamination errors reported by sorters.
This approach can also streamline training and accountability. Let’s say an employee’s area consistently shows high contamination in recyclables. A performance management tool can flag that trend early, prompting an HR-led coaching session or additional on-the-job training.
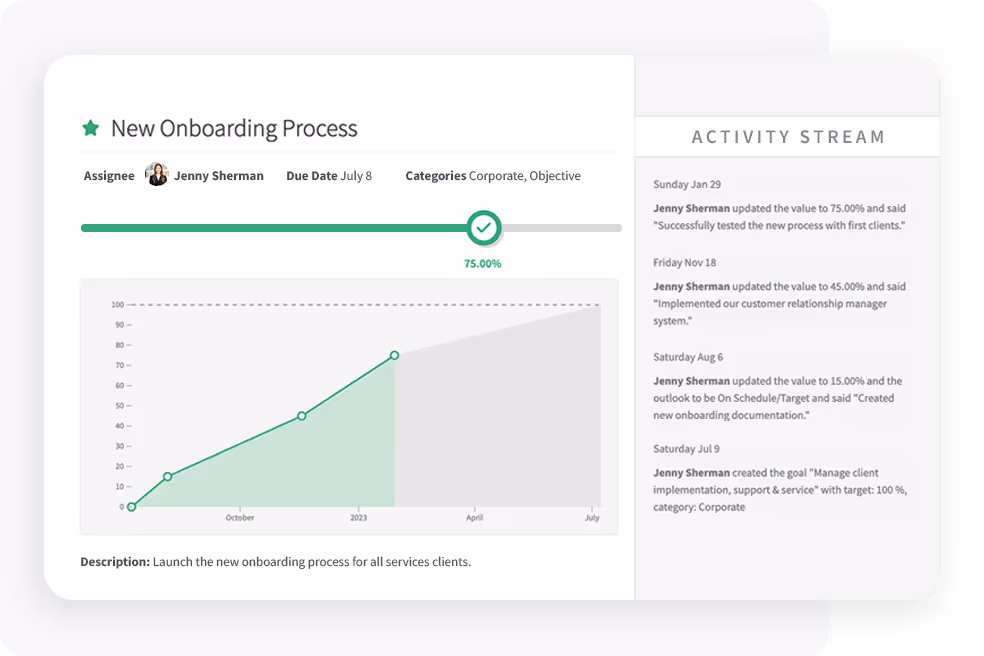
Organizations can also build “green goals” into annual evaluations, so employees who excel at waste reduction or champion recycling programs earn tangible recognition—like bonus points or a line on their performance review. It’s a neat way to align personal development with corporate sustainability targets.
Learn how your environmental services company can leverage PerformYard with a free demo.

60 Employee Performance Goal Examples for 2026

Best OKR Management Software - Top Tools By Type
.jpg)
