2026 State of Performance Management Report
The PerformYard State of Performance Management Report delivers data-driven insights on performance trends, best practices, and organizational impact in 2026.

Performance Management
Performance review design and feedback culture directly shape completion rates, engagement scores, and goal achievement.
Many organizations struggle to design performance management processes that balance structured reviews with meaningful employee engagement. This report identifies which practices consistently produce stronger employee and business outcomes.
This matters because specific factors like review form length, feedback culture, and qualitative questions directly influence completion rates, engagement scores, and goal achievement. Poor design weakens motivation and limits visibility into true performance.
Our analysis of anonymized data from more than 2,000 PerformYard customers shows which design choices drive measurable improvements, helping organizations refine their systems to increase completion, engagement, and goal tracking accuracy.

Data-Driven Insights
Foundation for effective decisions

Feedback Culture
Continuous improvement cycle

Goal Alignment
Strategic direction and focus

Company Growth
Organizational success outcome
Table of Contents
Learn how review, design, manager span of control, and industry-specific practices influence engagement, goal completion, and company growth.
Review Form Design
How Review Form Length Impacts Completion and Goal Achievement
Review Completion Rate by Number of Questions on Review Form
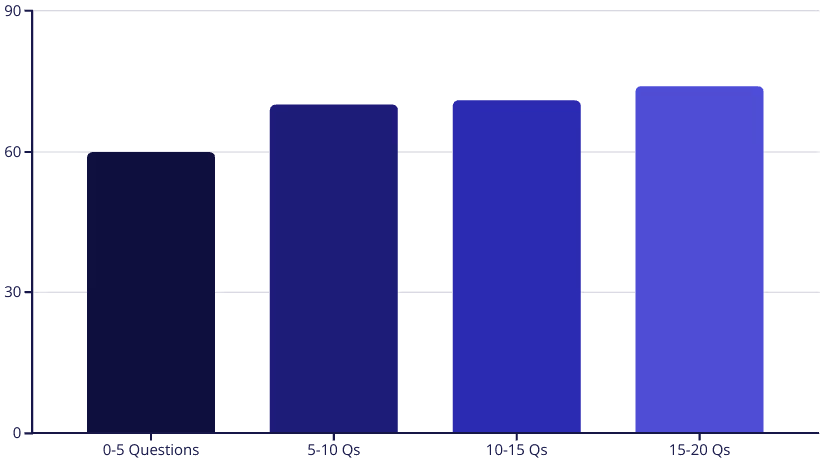
The data shows clear relationships between form length and employee behavior. Review form length influences completion rates, goal achievement, and the perceived value of the review process.
Key Findings
Too Few Questions
Reviews with 5 or fewer questions saw the lowest review completion rates, indicating that too short can be considered insufficient.

Optimal Range of Questions
Review forms with five or fewer questions had the lowest completion rates, indicating that very short forms reduce employee engagement.

Goal Completion Sweet Spot
Review forms with 15–20 questions achieved the highest completion rates, showing that employees complete reviews they view as meaningful and well-structured.
Review Completion Rate
How Open-Ended Text Questions Influence Completion Rates
Review Completion Rate by Number of Long-Text Questions
Open-ended questions help reviewers provide meaningful qualitative feedback and increase investment in the process. However, too many long-text questions create form fatigue, which reduces completion rates.

Key Findings
≤2 Questions
Forms with two or fewer long-text questions show significantly lower completion rates, indicating that too few qualitative prompts reduce engagement.
3-5 Questions
Forms with three to five long-text questions achieve the highest completion rates, showing that employees respond well to a balanced level of qualitative input.
27% Completion Boost
Forms with 3–5 long-text questions generate a 27% higher completion rate compared to forms with two or fewer, demonstrating a clear optimal range.
Goal Setting
Goal Completion Rate by Number of Goals Set
How many goals should each employee set?
Employees who set 20–30 goals per year complete 38% more goals than employees who set five or fewer. Higher goal counts give employees clearer direction and more opportunities to track progress, which increases engagement with the review process.
Setting too few goals often reduces structure and motivation, leading to lower completion rates and weaker performance outcomes.

Employees that set 20-30 goals per year finish 38% more of their goals

Qualitative Feedback
How Feedback Volume Affects Employee Satisfaction and eNPS
PerformYard enables employees to send qualitative feedback to any colleague at any time. Qualitative feedback differs from eNPS and Employee Satisfaction surveys, and the data shows that higher feedback volume does not always correlate with higher satisfaction. Feedback culture influences satisfaction differently depending on company size and feedback volume.
Optimal Feedback Volume
In companies with 250+ employees, satisfaction scores peak when 20–40 employees give qualitative feedback comments. This indicates that a moderate amount of feedback supports stronger satisfaction levels.
Diminishing Returns
When more than 200 employees provide qualitative feedback comments, satisfaction scores drop by 12%, demonstrating that excessive feedback can overwhelm employees and reduce satisfaction.
eNPS Impact
For larger organizations, eNPS scores peak when about 60 employees give feedback. Scores decline sharply when 150–160 employees contribute feedback, suggesting that too much feedback reduces clarity and creates noise.
Constructive Performance Management
How Consistent Review Cycles Improve Employee Satisfaction Over Time
Regular, constructive performance management increases employee engagement. Higher engagement improves retention, strengthens customer satisfaction, and supports long-term business performance.
PerformYard’s structured performance management process provides clear year-over-year visibility into how ongoing reviews and feedback improve employee satisfaction and eNPS.
- Year 1: Organizations establish baseline satisfaction and eNPS scores when they begin using PerformYard
- Year 2: Continued performance management creates more consistent feedback cycles and stabilizes satisfaction metrics
- Year 3: Ongoing measurement and structured reviews strengthen engagement and improve satisfaction trends
- Year 4: Employee satisfaction scores are 7% higher, and eNPS scores are 6.5% higher than Year 1, demonstrating clear long-term impact from consistent performance management

Streamlining the Process
How PerformYard Reduces Time to Complete Reviews
PerformYard streamlines review workflows, helping organizations spend less time on administrative tasks and more time on direct feedback and coaching. More efficient review cycles support higher productivity and stronger employee engagement.
How PerformYard’s Streamlined Review Process Saves Time

Year 1 Baseline
Organizations establish baseline review completion times when they adopt PerformYard.

Year 2 with PerformYard
Companies complete reviews 19% faster than in Year 1, demonstrating immediate efficiency gains.

Year 3 with PerformYard
Review completion time improves by an additional 11% compared to Year 2, and is 28% faster than the original Year 1 baseline.
Consistent Performance Management
How Long-Term Use of PerformYard Increases Goal Completion Rates
Long-term PerformYard users experience steady improvements in goal attainment. Companies in Year 3 of using PerformYard complete 36% more goals than companies in Year 1. Sustained performance management cycles strengthen clarity, alignment, and follow-through.
By Year 4, companies achieve 60% higher completion rates, demonstrating the compounding effect of consistent goal-setting and tracking.
Year 1: 72% Goal Completion Rate
Organizations begin their performance management journey and establish baseline metrics

Year 2: 73% Goal Completion Rate
Goal completion increases slightly as processes stabilize and teams adapt

Year 3: 78% Goal Completion Rate
Goal completion is 8% higher than Year 1 and reflects stronger alignment and tracking

Year 4: 92% Completion Rate
Goal completion is 27% higher than Year 1, showing substantial improvement after four years of consistent performance management
Industry & Company Insights
Our data identifies clear performance management patterns across various industries and organization sizes. Industry norms and company size influence employee engagement, satisfaction, and goal completion rates in measurable ways.
This section analyzes which specific company characteristics shape performance management outcomes and highlights the differences leaders should expect when comparing organizations of different sizes or operating in different industries.

Finding Balance
How Manager-to-Direct-Report Ratios Influence eNPS and Performance
For every five additional direct reports per manager, eNPS scores decline by 2%. Companies where managers oversee 0–5 direct reports have 7% higher eNPS scores than companies with 15+ direct reports, showing how span of control impacts employee experience.
High-Turnover Industries
Companies in high-turnover industries (40%+ annual turnover) have an average of 6.5 direct reports per manager, which is 15% higher than the 5.6 seen in low-turnover industries (20% or less).
According to the Center for American Progress, replacing an employee can cost up to 213% of annual salary, especially for senior roles.
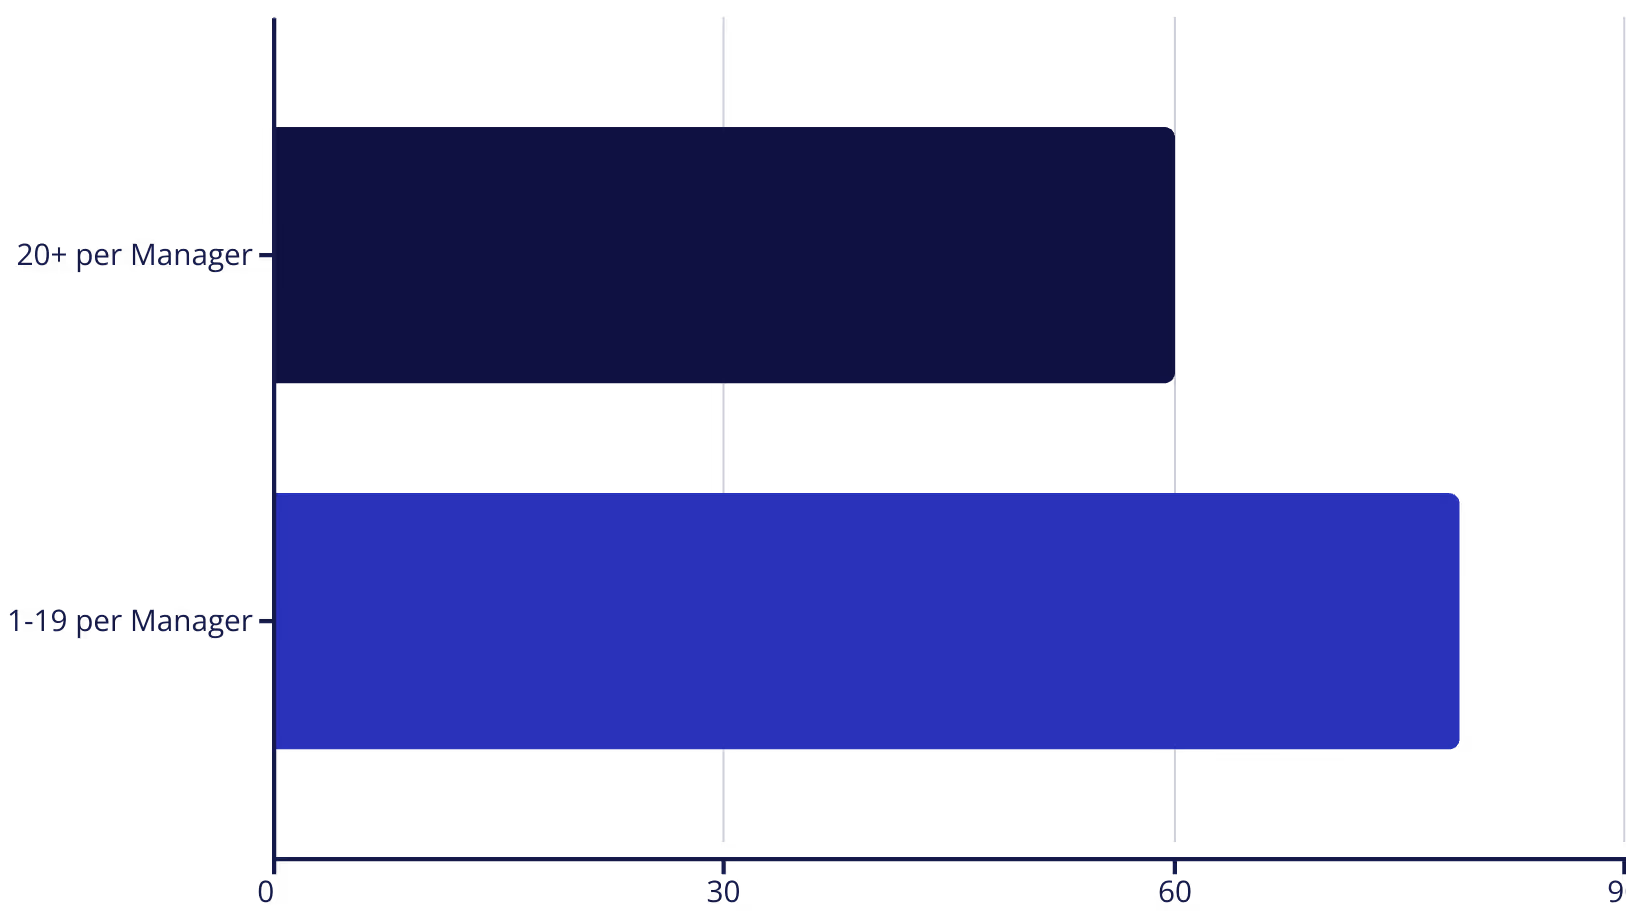
Impact on Goal Completion
When managers oversee 20+ direct reports, average goal completion is 60%. Companies with lower ratios achieve 79% goal completion, showing that larger team sizes reduce the level of support managers can provide and lower overall performance outcomes.
Employee Engagement
eNPS Scores by Number of Direct Reports
Manager span of control directly affects employee engagement. Smaller teams consistently show higher satisfaction because managers have more capacity for feedback and support.

Key Findings
Declining Satisfaction
Every additional five direct reports per manager reduces eNPS scores by approximately 2%, showing a clear negative relationship between large team sizes and engagement.

Optimal Team Size
Managers with 1–5 direct reports lead teams with 7% higher eNPS scores compared to managers with 15+ direct reports, indicating that smaller teams support stronger employee engagement.

Quality Interactions
Smaller teams give managers more time for one-on-one feedback and personalized development, which contributes to higher engagement scores and improved employee experience.
Finding Balance
Goal Completion Rates by Manager-to-Direct Report Ratio
Finding the right span of control directly affects performance metrics. Smaller manager-to-direct report ratios improve goal completion rates and support stronger employee engagement.
Key Insights
Open-Ended Text Question Usage by Industry: How Industries Differ in Qualitative vs Quantitative Review Design
Industries With Most Open-Text Questions
- Apparel & Fashion
- Restaurants
- Utilities
- Research
- Religious Institutions
Common themes:
Industries that rely heavily on open-text questions often need subjective assessments of creativity, customer service, or complex safety procedures.
Industries With Fewest Open-Text Questions
- Human Resources
- Biotechnology
- Banking
- Pharmaceuticals
- Marketing & Advertising
Common themes:
Industries that use fewer open-text questions tend to emphasize compliance requirements, standardized procedures, and data-driven performance metrics that are easier to quantify.


Key Insights
Open-Ended Text Answer Length by Industry
Industries With the Longest Open-Text Answers
- Research
- Biotechnology
- Venture Capital
- Pharmaceuticals
- Investment Management
Common themes:
These knowledge-intensive industries require deeper analysis, so employees tend to provide longer, more detailed qualitative answers.
Susan Snipes, Owner and Principal Consultant at Employ HR Pro has noticed a stark difference related to company size, "From my experience, smaller companies use more qualitative data with open-ended questions that require several lines of text response per question."
Industries With the Shortest Open-Text Answers
- Manufacturing
- Mechanical Engineering
- Construction
- Transportation/Trucking
- Consumer Services
Common themes:
These task-oriented industries focus on execution and efficiency, so employees typically give shorter, more concise qualitative responses.
Industry Benchmarks
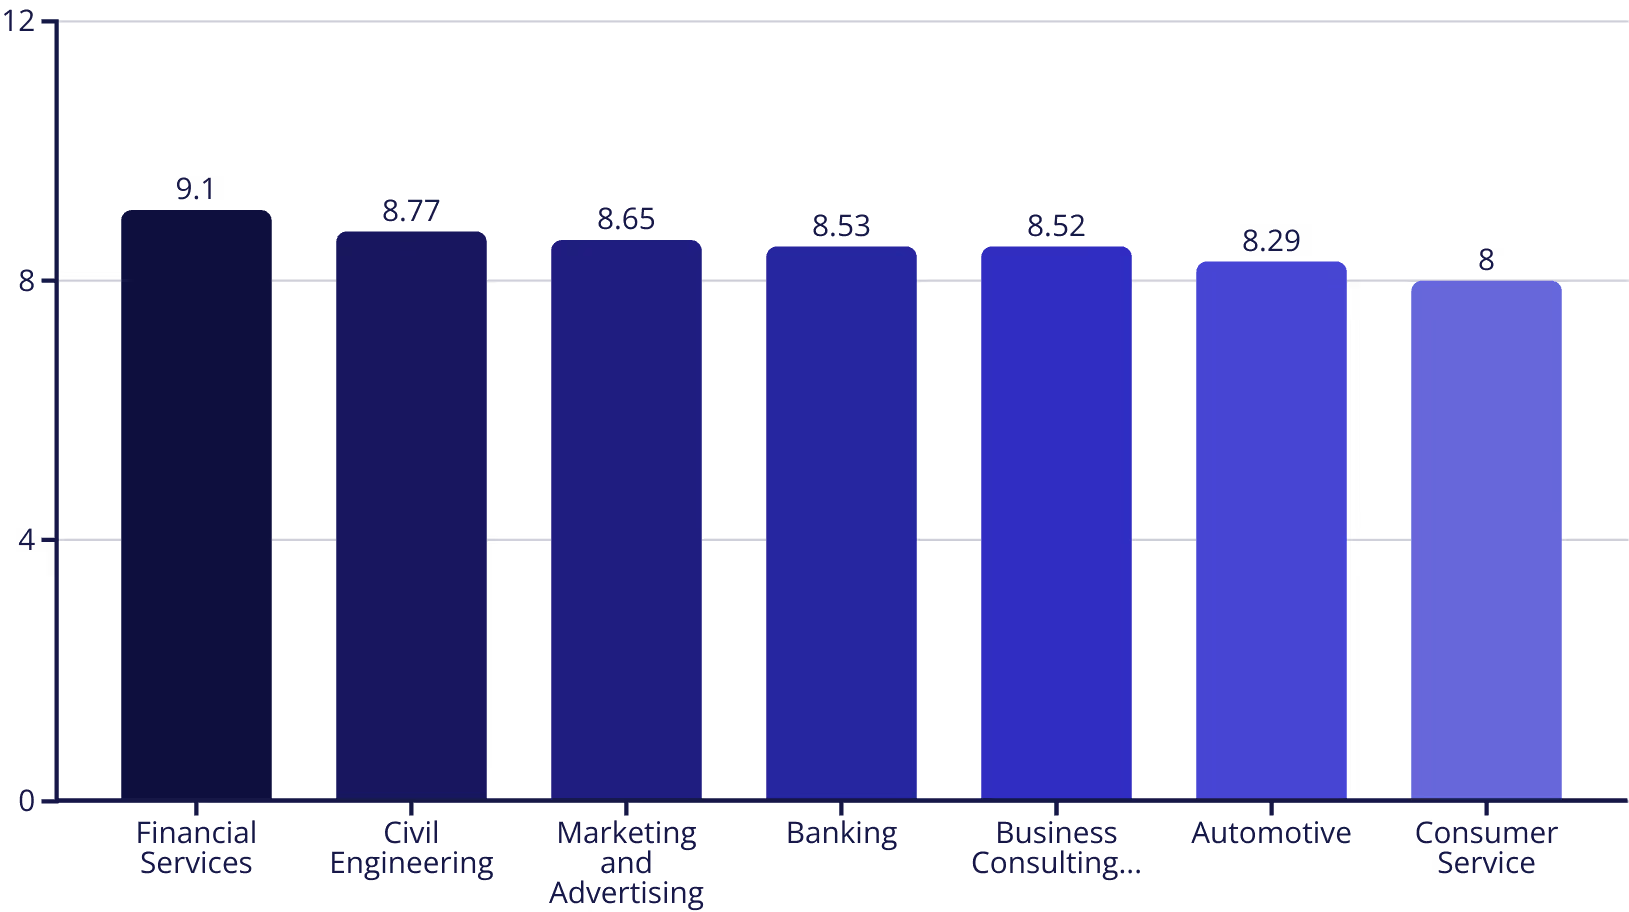
Engagement and eNPS Scores by Industry
The chart below shows clear variation in average eNPS scores across industries. Financial Services has the highest eNPS score (9.1), followed by Civil Engineering (8.77) and Marketing & Advertising (8.65). Consumer Service scores lowest at 8.0. These differences illustrate how industry context influences employee engagement, manager effectiveness, and workplace satisfaction.
Understanding these benchmarks helps your organization compare itself to industry norms and identify opportunities to improve engagement and retention.
Headcount Growth Benchmarks
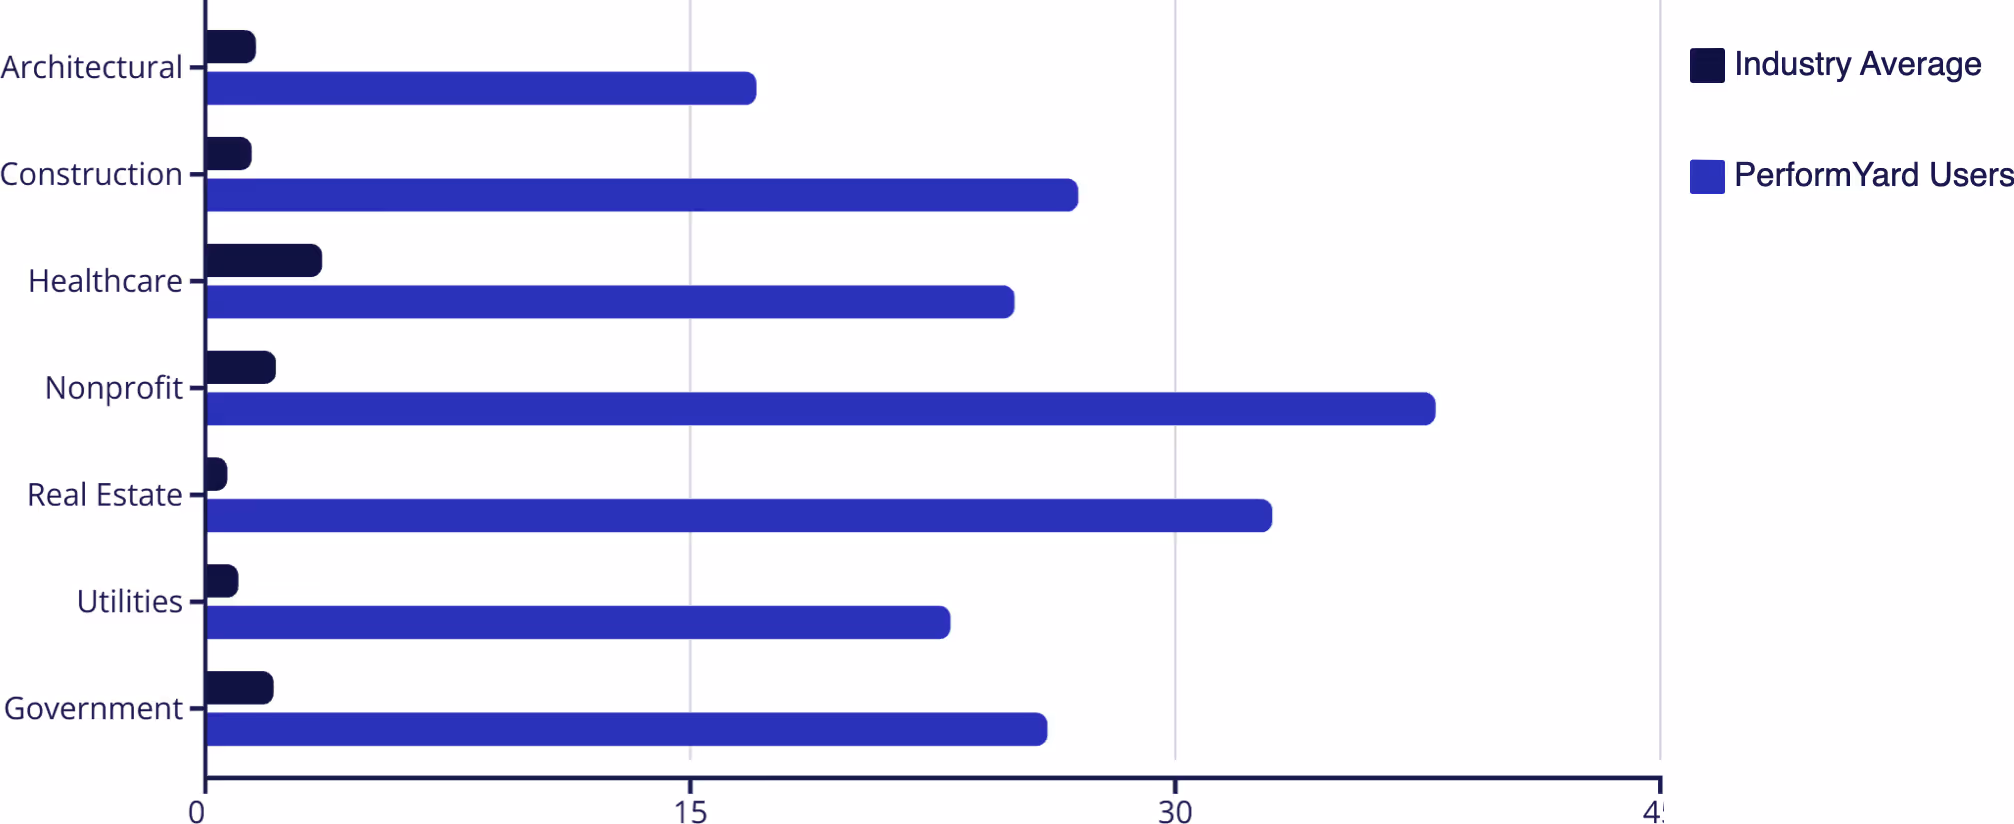
How PerformYard Clients Outpace Industry Growth Rates
Companies using PerformYard show significantly higher year-over-year headcount growth than industry averages across multiple sectors. The chart shows large gaps between PerformYard organizations and their industry peers. For example, Nonprofit organizations using PerformYard grow by more than 35%, compared to low single-digit growth for the sector overall. Construction, Real Estate, Healthcare, and Government sectors also show substantial outperformance.
This trend suggests that strong performance management systems support faster scaling and more consistent organizational growth.
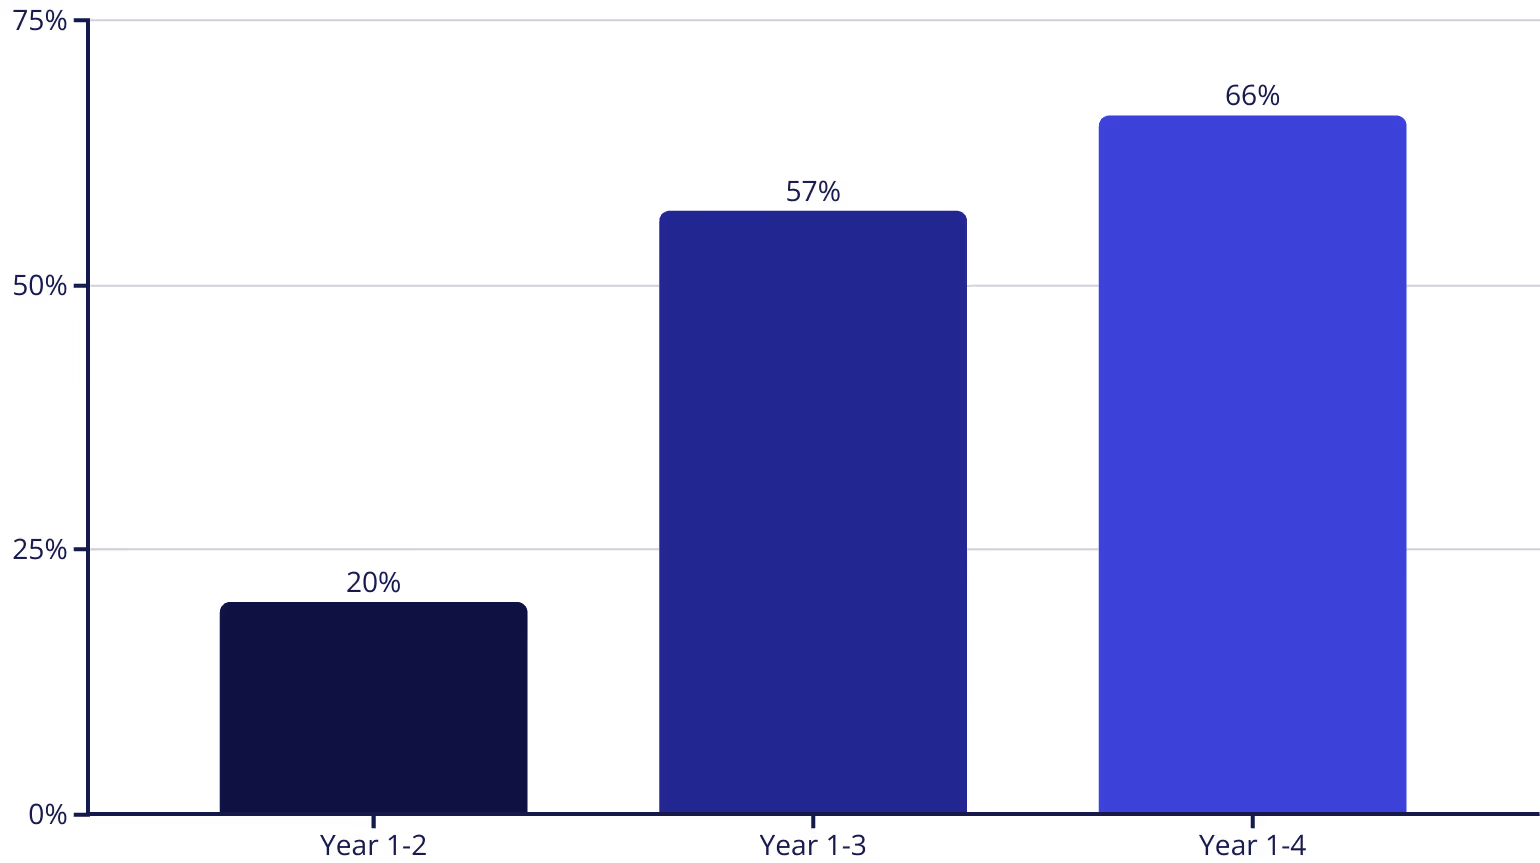
Cumulative Headcount Growth
How Long-Term Use of PerformYard Supports Scalable Performance Management
Companies using PerformYard see substantial cumulative headcount growth over time. Organizations grow an average of 20% from Year 1 to Year 2, 57% from Year 1 to Year 3, and 66% from Year 1 to Year 4. This trend shows how consistent performance management practices support measurable organizational expansion.
PerformYard helps companies scale by creating more structured review cycles, strengthening alignment, and improving employee engagement—factors that contribute directly to sustainable team growth.
Company Size and Employee Satisfaction
How Organization Size Influences eNPS and Engagement
Understanding these patterns can help organizations optimize their performance management approach based on their size and growth stage.
Large Companies (750+ Employees)
Highest eNPS scores
Large companies have the highest eNPS scores, supported by greater resource availability, clearer career progression, and more organizational stability.

Company size significantly shapes performance management needs. Larger organizations tend to achieve stronger satisfaction outcomes because they offer more structured processes, defined roles, and stable career paths.
Mid-Size Companies (100-250 Employees)
Lowest eNPS scores
Mid-size companies report the lowest eNPS scores. Rapid growth, evolving structures, and shifting roles can reduce clarity and negatively influence employee sentiment.

eNPS Benchmarks by Company Size
How Organization Size Influences Employee Engagement
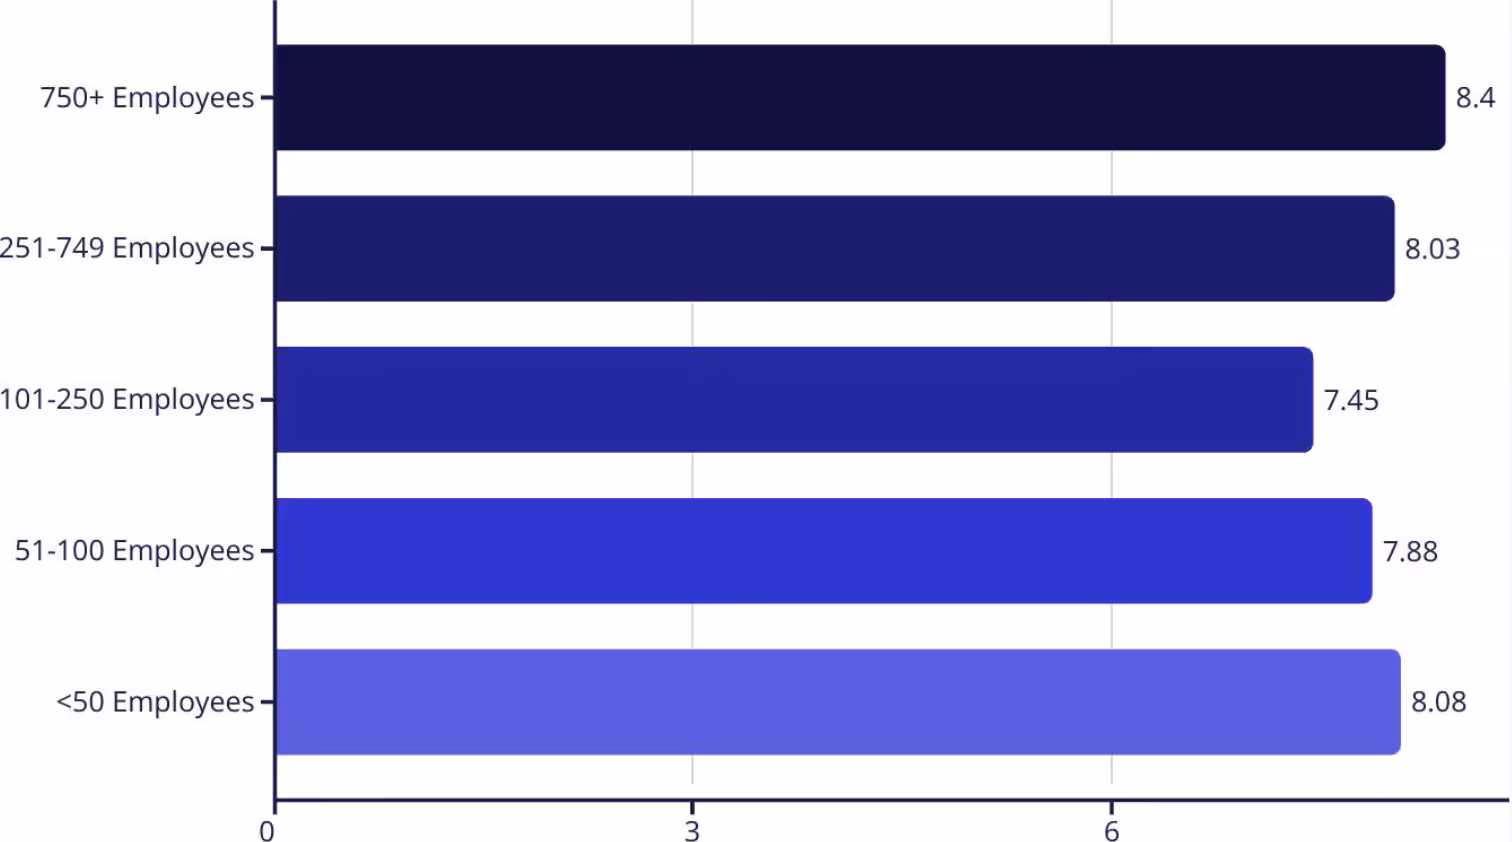
- Mid-size companies (101–250 employees) have the lowest eNPS scores at 7.45. Large enterprises (750+ employees) have the highest eNPS scores at 8.4, and small companies (<50 employees) also perform well at 8.08.
Why Mid-Size Companies Score Lower
Companies in the 101–250 employee range often face structural challenges that reduce satisfaction. Evolving management layers, communication gaps, and role ambiguity create friction. These organizations frequently outgrow informal processes but have not yet built mature HR systems. Rapid growth also puts pressure on culture, creating tension between early hires and newer employees.
Why Large and Small Companies Score Higher
Large organizations benefit from established career paths, stronger resources, and formalized performance management systems, which lead to higher engagement. Small companies maintain relatively high eNPS scores through close-knit cultures, clearer communication, and direct access to leadership.
Forms per Review by Company Size
How Company Size Shapes Review Structure and Goal Setting
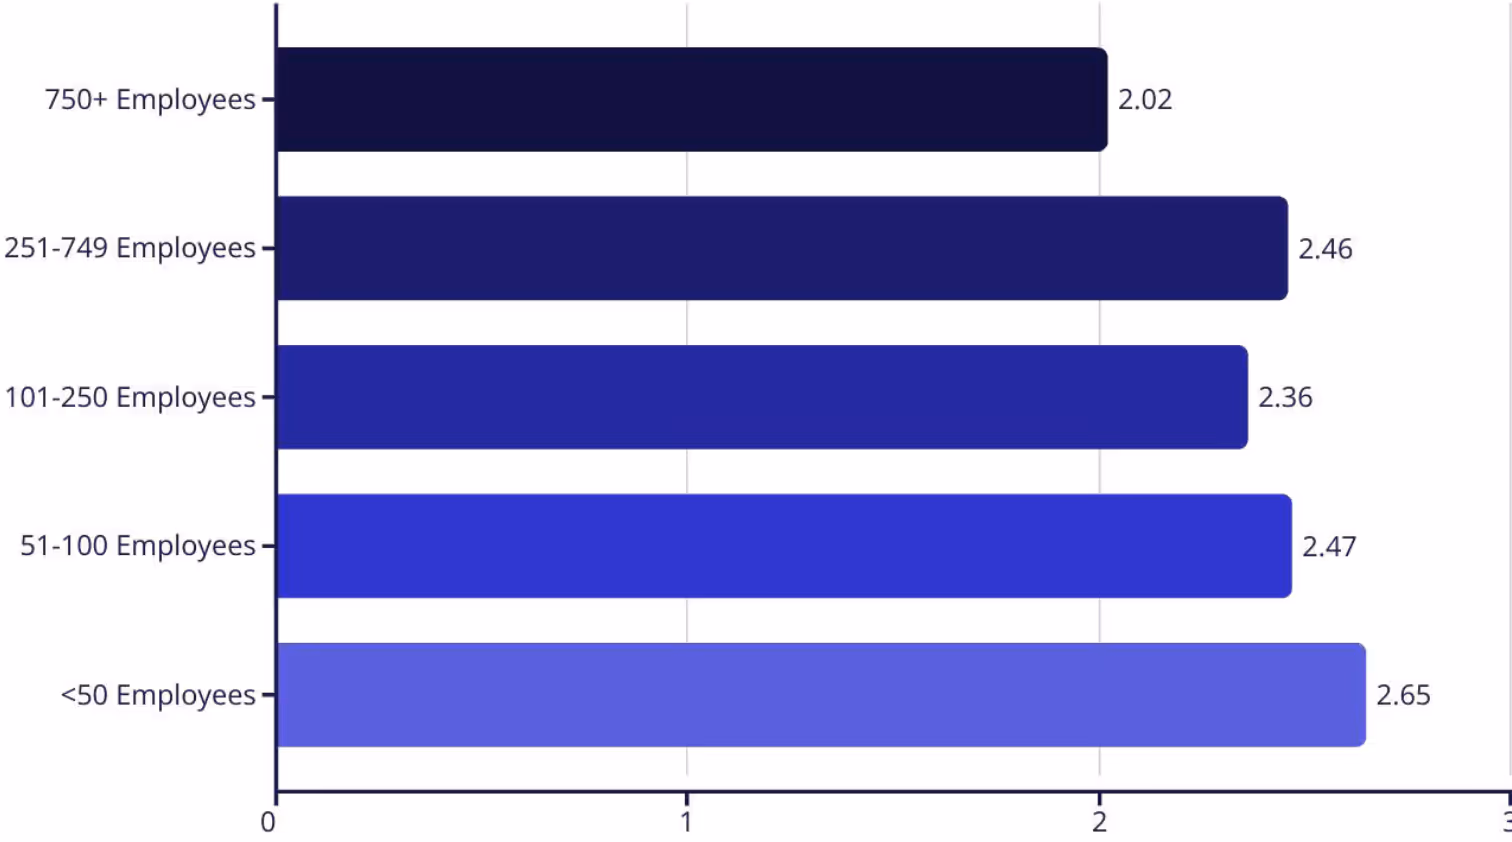
A review cycle may include self-assessments, 360-feedback, goal-setting forms, and other components. Smaller companies use more forms per review, while large enterprises streamline their cycles and use fewer.
Small Companies (<50 employees)
Small companies use the highest number of forms per review cycle (2.65). They also set the most goals per employee, reflecting a flexible, hands-on culture with strong leadership involvement and ambitious goal-setting expectations.
Large Enterprises (750+)
Large organizations use the fewest forms per review cycle (2.02) and set fewer goals per employee. Their performance management systems emphasize streamlined documentation, standardized frameworks, and strategic alignment across the company.
Optimal Review Structure Benchmarks
The Data-Backed Sweet Spot for Questions, Goals, and Informal Feedback
10–15 Total Questions Per Review
This range produces the highest goal completion rates. Employees engage more deeply when reviews are structured but not overwhelming, and they prefer formats that allow thoughtful reflection.
20–40 Sources of Informal Feedback
Larger companies see the highest employee satisfaction when 20–40 people provide informal feedback. When more than 100 people leave comments, satisfaction levels decline, suggesting feedback overload creates noise rather than clarity.
3–5 Long-Text Questions Per Review Form
Review forms with 3–5 long-text questions achieve the highest review completion rates. Employees are willing to provide written responses when prompts are meaningful and well-scoped.


Long-Term Impact of Performance Management
Compounding Benefits for Consistent PerformYard Users
Consistency Produces Measurable Returns
Companies using PerformYard for 3+ years see steady year-over-year improvements across goal completion, review completion, and headcount growth. Long-term adoption creates predictable performance habits that strengthen alignment and execution.
Stronger Engagement and Culture
Investing in performance management signals a commitment to growth, feedback, and accountability. Organizations that maintain consistent review cycles build cultures where performance expectations are clearer and employees feel supported.
Outpacing Industry Growth Benchmarks
PerformYard clients experience rapid expansion. On average, companies grow 60% between Year 1 and Year 3, significantly exceeding typical industry growth rates. This trend shows that consistent performance management practices contribute to more scalable, sustainable organizational growth.
Review Strategies Vary by Industry and Company Size
There Is No One-Size-Fits-All Approach
Tailored Reviews Fit Different Organizational Needs
Industry and company size strongly influence review length, question types, and feedback expectations. Organizations design review processes that reflect their operational complexity and growth stage.
Smaller Companies (<100 Employees)
Smaller companies typically use longer reviews and set more goals per employee. Their hands-on culture and direct leadership involvement encourage detailed reflection and ambitious goal setting.
Mid-Size Companies (100–250 Employees)
Mid-size companies often experience lower satisfaction scores. Rapid growth, evolving structures, and shifting roles can create friction and reduce engagement.
Larger Companies (750+ Employees)
Large enterprises rely on shorter, more streamlined reviews and set fewer goals per employee, yet they maintain the highest employee satisfaction scores due to clearer career paths and mature HR systems.
Impact of Rapid Growth
Organizations undergoing fast expansion frequently see a decline in employee satisfaction, as informal processes break down and clarity, communication, and role stability become harder to maintain

Join thousands of HR leaders who use PerformYard to achieve higher review completion, stronger employee satisfaction, and scalable headcount growth driven by consistent, data-backed performance management practices.
See the data-backed impact of PerformYard for yourself.
Frequently Asked Questions
Get answers to common questions about our 2025 State of Performance Management Report.
How was the data for this report collected?
The data comes from anonymized performance management records from more than 2,000 PerformYard customers across industries and company sizes. These organizations contribute aggregated metrics on growth, turnover, satisfaction, and review practices, allowing us to identify patterns based on how long each company has used PerformYard.
How often is this report updated?
The State of Performance Management Report is updated annually. Each edition incorporates the latest customer data, emerging trends, and shifts in performance management practices to help HR teams make informed decisions.
Can I share this report with my team?
Yes. You are free to share the State of Performance Management Report with colleagues. After downloading the full report, you can use the insights to align review processes, goal-setting practices, and engagement strategies.
How can I implement these findings in my organization?
Start by identifying the insights that match your current challenges.
- Choose one or two focus areas, such as review structure or goal clarity.
- Introduce small changes to your existing process.
- Track results over the next review cycle to measure impact.
Applying these findings over time helps organizations improve completion rates, engagement, and performance alignment.
- Choose one or two focus areas, such as review structure or goal clarity.
- Introduce small changes to your existing process.
- Track results over the next review cycle to measure impact.Applying these findings over time helps organizations improve completion rates, engagement, and performance alignment.
How do I get started with PerformYard performance management software?
Teams get started by requesting a demo. A PerformYard specialist will walk you through the platform, answer questions, and show how the software can streamline reviews, improve goal tracking, and strengthen employee engagement.